Contents
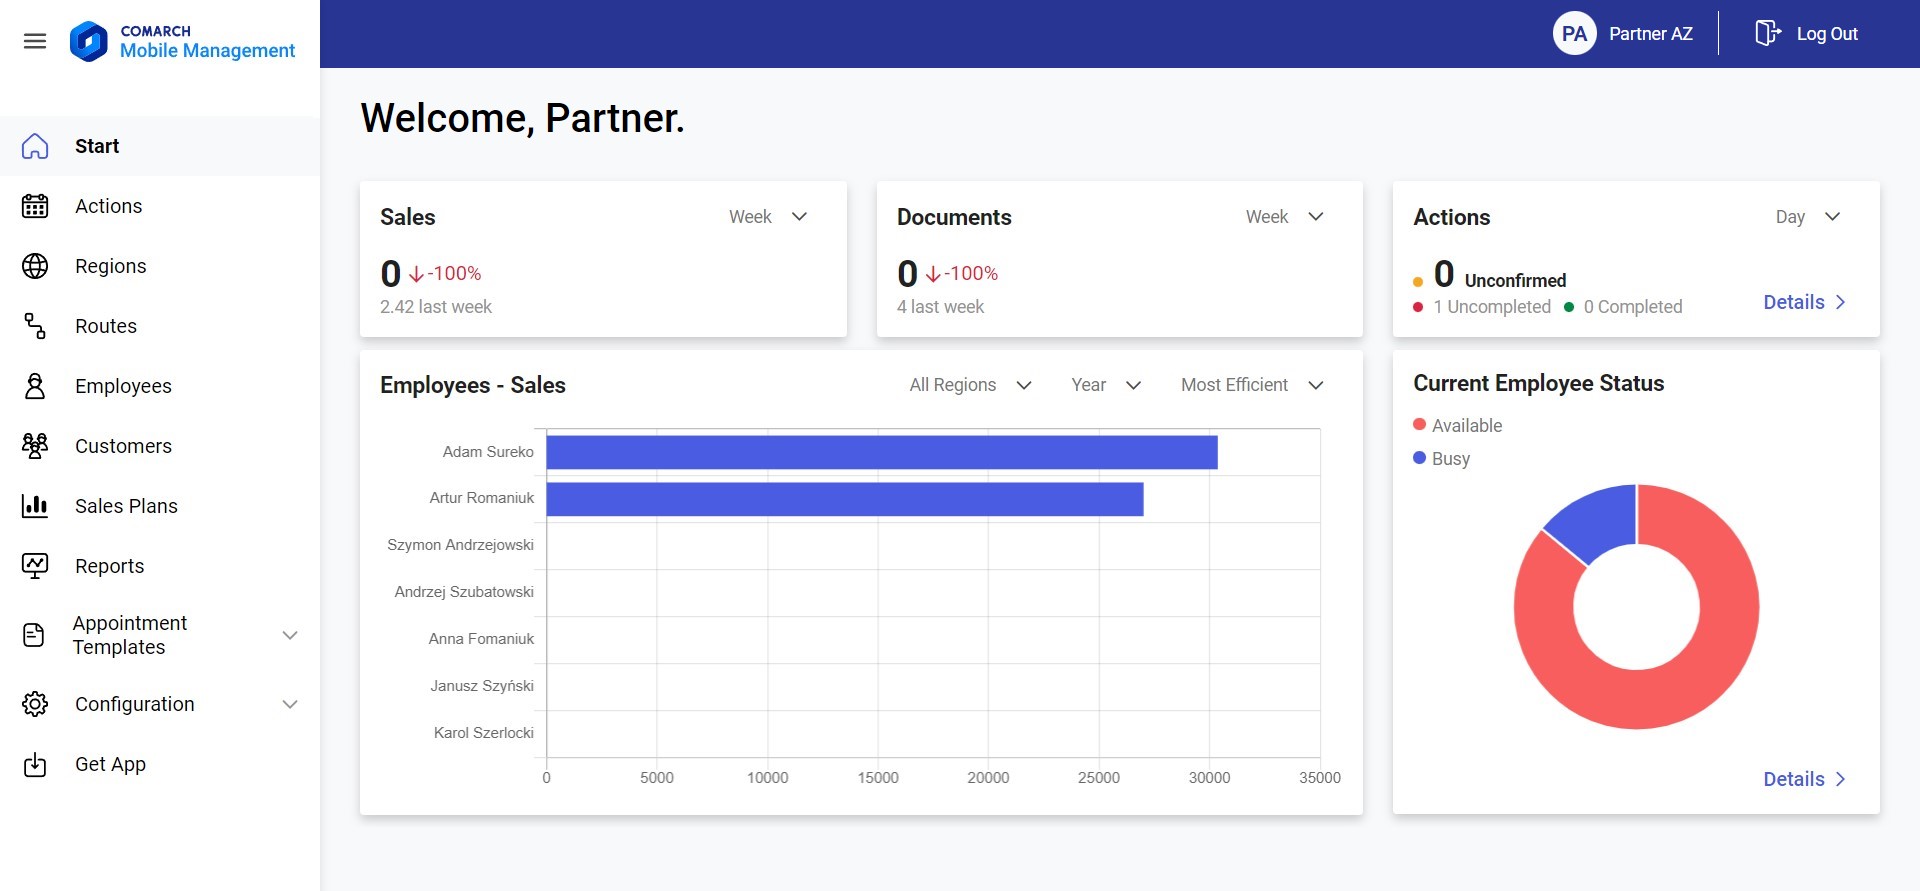
After logging in to the application, you can see the start screen of the application. The screen’s layout may vary depending on your permissions. See the Permissions article for more information about user permissions.
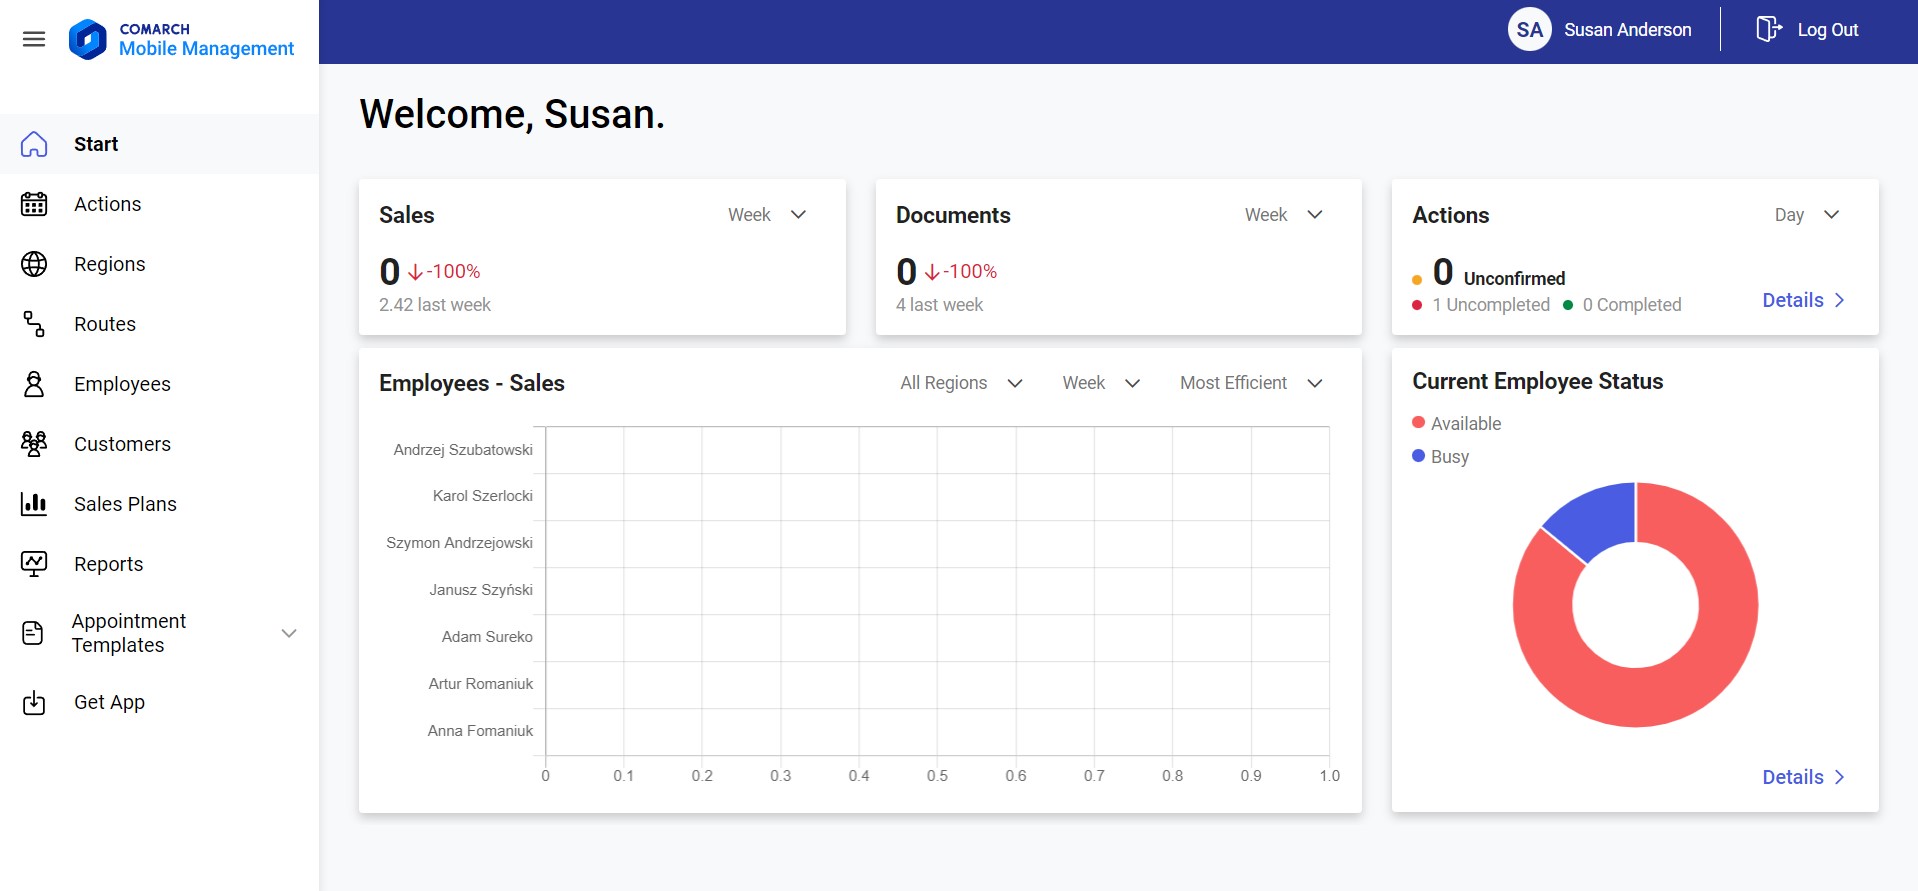
Layout for users with administrator permissions
A user with administrator permissions has access to the following tiles:
- Sales
- Documents
- Actions
- Employees – Sales
- Current Employee Status
The start screen of a user with permissions to Management module is presented below:
Sales

The Sales tile presents the subtotal value of SO documents issued in Comarch Mobile depending on a selected range:
- Day – it displays the value of documents whose date of issue is the current date
- Week – the default value; it displays the value of documents whose date of issue falls within the current week
- Month – it displays the value of documents whose date of issue falls within the current month
- Year – it displays the value of documents whose date of issue falls within the current year
Also, the Sales tile presents information on the percentage difference between the value of the current period and the previous period. If the difference has a positive value, a green arrow will present it. If the difference has a negative value, the arrow will change its color to red. The presented values are rounded to integers.
Documents

The Documents tile presents a value specifying the number of documents issued within a given period. The summary refers to SO documents issued within the period of:
- Day – it displays the number of documents whose date of issue is the current date
- Week – the default value; it displays the number of documents whose date of issue falls within the current week
- Month – it displays the number of documents whose date of issue falls within the current month
- Year – it displays the number of documents whose date of issue falls within the current year
Also, the Documents tile presents information on the percentage difference between the value of the current period and the previous period. If the difference has a positive value, a green arrow will present it. If the difference has a negative value, the arrow will change its color to red. The presented values are rounded to integers.
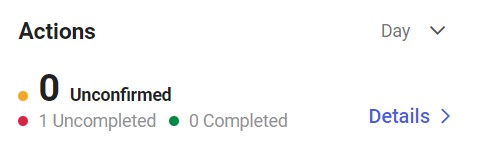
Actions
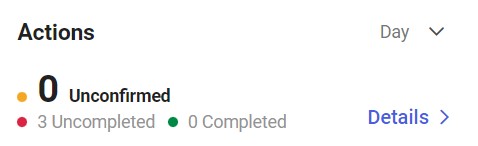
The Actions tile presents the number of unconfirmed actions. This value is calculated on the basis of all appointments with the status Unconfirmed whose supervisor is the logged-in user or an employee subordinate to him/her in the structure. Additionally, the tile shows information about the number of confirmed but uncompleted actions and the number of completed actions. It is possible to filter the displayed results by a specified range of time:
- Day – it displays the number of actions whose scheduled date is the current date
- Week – the default value; it displays the number of actions whose scheduled date falls within the current week
- Month – it displays the number of actions whose scheduled date falls within the current month
- Year – it displays the number of actions whose scheduled date falls within the current year
Employees – Sales
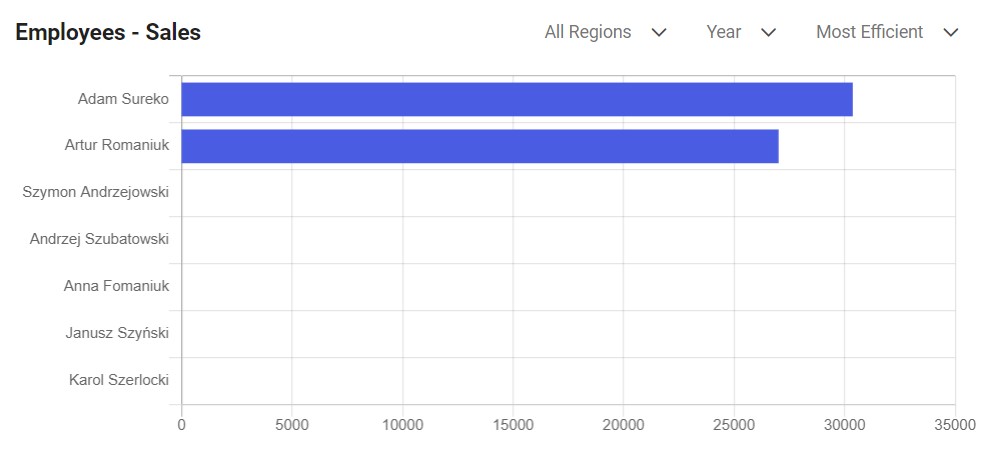
The Employees – Sales tile presents the sum of values of all the most productive employees who report to the logged-in manager, depending on the selected period and region. These values are calculated on the basis of confirmed SO, SQ, and SOI documents. It is also possible to filter the data on the chart by:
- Employee efficiency:
- Most Efficient
- Least Efficient
- Time range:
- Day – it displays the value of documents whose date of issue is the current date
- Week – the default value; it displays the value of documents whose date of issue falls within the current week
- Month – it displays the value of documents whose date of issue falls within the current month
- Year – it displays the value of documents whose date of issue falls within the current year
- Region – selecting the [Region] button displays a screen enabling you to select a region for which statistics are to be shown. This allows you to filter the list according to a region to which assigned employees belong. The list of regions is displayed as a tree structure sorted alphabetically. It can be narrowed down to a specific region by providing its name in the Search field or by selecting a given region from the displayed list of regions and subregions.
Current Employee Status
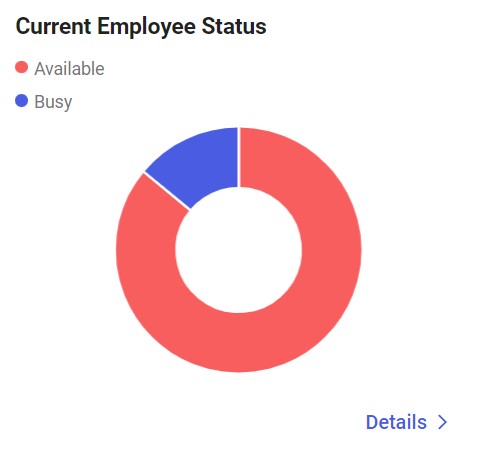
The Current Employee Status tile presents a percentage chart of employee statuses on the current date. The statuses displayed on the chart include:
- Busy – employees who have at least one scheduled action with a status other than Rejected
- Available – employees with no appointments scheduled for a given day
Selecting the [Details] button opens the list of employees.
Layout for users with manager permissions
A user with manager permissions has full access to all application modules, except for the Configuration module.
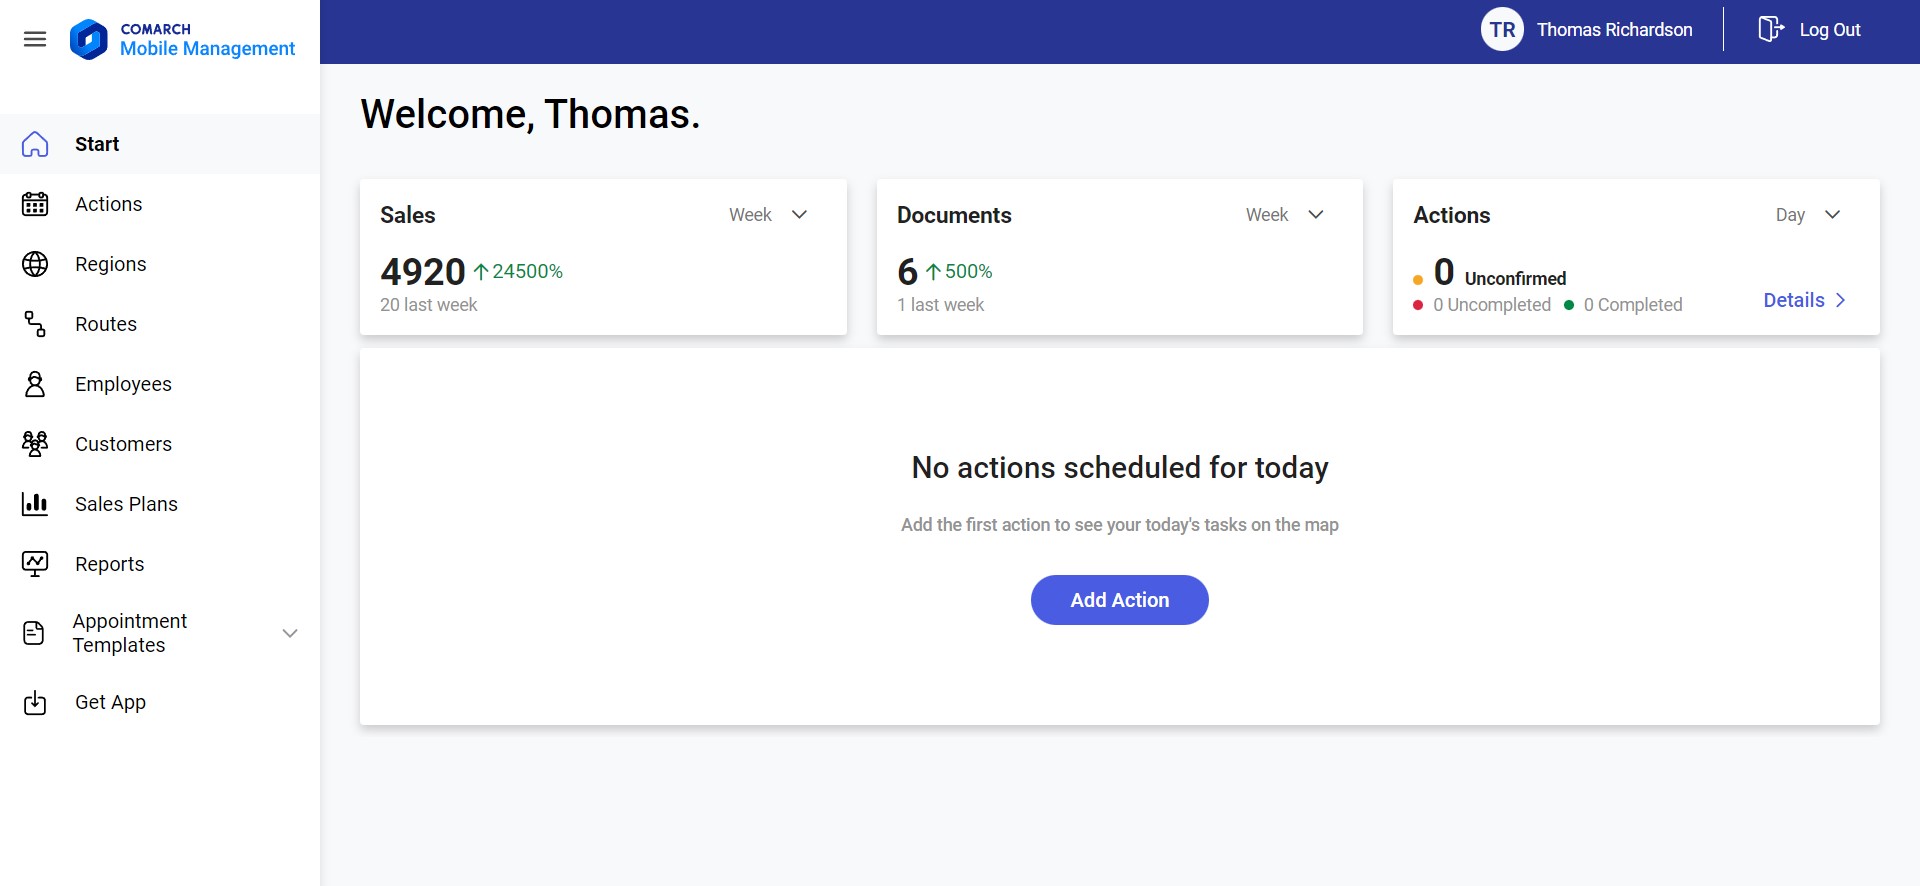
Layout for users with employee permissions
A user with employee permissions has access to the following tiles:
- Sales
- Documents
- Actions
- Scheduled for Today
Sales

The Sales tile presents the subtotal value of SO documents issued in Comarch Mobile depending on a selected range:
- Day – it displays the value of documents whose date of issue is the current date
- Week – the default value; it displays the value of documents whose date of issue falls within the current week
- Month – it displays the value of documents whose date of issue falls within the current month
- Year – it displays the value of documents whose date of issue falls within the current year
Also, the Sales tile presents information on the percentage difference between the value of the current period and the previous period. If the difference has a positive value, a green arrow will present it. If the difference has a negative value, the arrow will change its color to red. The presented values are rounded to integers.
Documents

The Documents tile presents a value specifying the number of documents issued within a given period. The summary refers to SO documents issued within the period of:
- Day – it displays the number of documents whose date of issue is the current date
- Week – the default value; it displays the number of documents whose date of issue falls within the current week
- Month – it displays the number of documents whose date of issue falls within the current month
- Year – it displays the number of documents whose date of issue falls within the current year
Also, the Documents tile presents information on the percentage difference between the value of the current period and the previous period. If the difference has a positive value, a green arrow will present it. If the difference has a negative value, the arrow will change its color to red. The presented values are rounded to integers.
Actions
The Actions tile presents the number of unconfirmed actions. This value is calculated on the basis of all appointments with the status Unconfirmed whose supervisor is the logged-in user. Additionally, the tile shows information about the number of confirmed but uncompleted actions and the number of completed actions. It is possible to filter the displayed results by a specified range of time:
- Day – it displays the number of actions whose scheduled date is the current date
- Week – the default value; it displays the number of actions whose scheduled date falls within the current week
- Month – it displays the number of actions whose scheduled date falls within the current month
- Year – it displays the number of actions whose scheduled date falls within the current year
Scheduled for Today
The Scheduled for Today tile presents a map with the employee’s actions scheduled for the current day. If the employee does not have any actions scheduled, the tile displays the message “No actions scheduled for today” along with the [Add Action] button opening the action scheduling screen.

If the employee has at least one action assigned, the tile displays a map with customers marked on it.
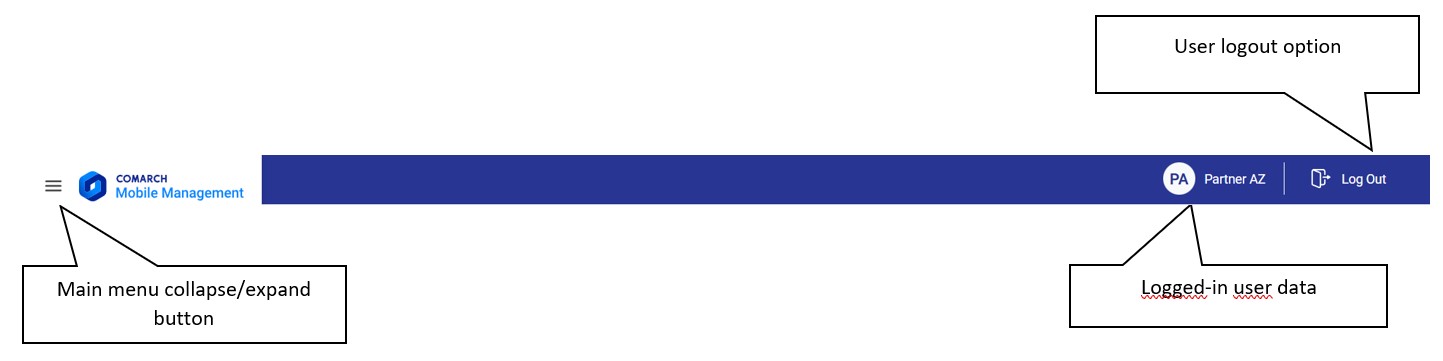
Main menu
The main menu of the application in both the horizontal and vertical view is located on the left-hand side of the screen. Its contents may vary, depending on your permissions. Additionally, it is possible to collapse the menu so that it does not take up space.
- Home – basic information for the logged-in user
- Actions – the list of actions
- Regions – the list of regions
- Routes – the list of registered routes
- Employees – the list of employees
- Customers – the list of customers
- Sales Plans – the list of sales plans
- Reports – sales plan reports
- Appointment Templates:
- Route Templates – preview and editing of route templates
- Appointment Templates – definition and editing of appointment templates
- Template Elements – definition and editing of template elements
- Directories – definition and editing of directory data
- Vehicles – definition and editing of vehicles
- Configuration:
- Profiles – definition and editing of profiles
- Users – definition and editing of users
- Get App
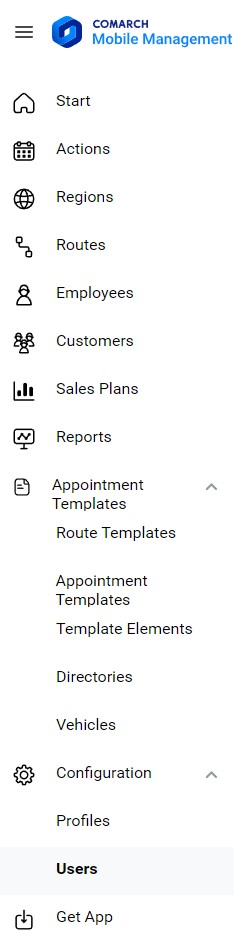
The currently selected item of the main menu is marked in bold. Individual items of the main menu are described in detail in separate articles of this knowledge base.
Header
While using particular areas/screens of the application, you can select the context menu buttons located in the header. The header is an integral part of the application and the buttons contained in it allow collapsing/expanding the main menu and logging out of the application. The figure below presents the application’s header along with its description.