Demand forecast is used for analyzing the sales volume of items from defined warehouses in a specified time interval. On its basis it is possible to forecast the future sales volume and generate documents allowing for replenishing a warehouse with an appropriate quantity of items within an appropriate time.
A list of demand forecast documents is available in menu Warehouse (Resources) Demand Forecasts
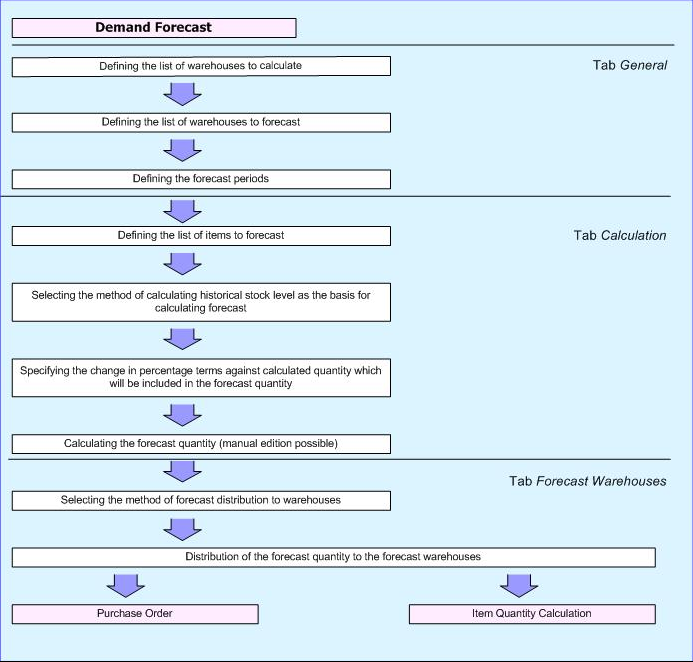
The demand forecasting process can be executed in several stages:
defining warehouses on the basis of which the historical stock levels will be calculated
defining warehouses for which the quantity forecasts will be calculated
defining the periods for which the forecasting will be performed
determining the method for calculation of item forecasts:
defining the period as the basis for calculation
determining the percentage quantity change in relation to the quantity calculated on the basis of the selected period
calculating the forecast quantity on the basis of the selected criteria for items
defining the method of distributing the forecast quantity into warehouses
distribution of the forecast quantity into individual warehouses
Scheme of creating demand forecast
Creating a demand forecast
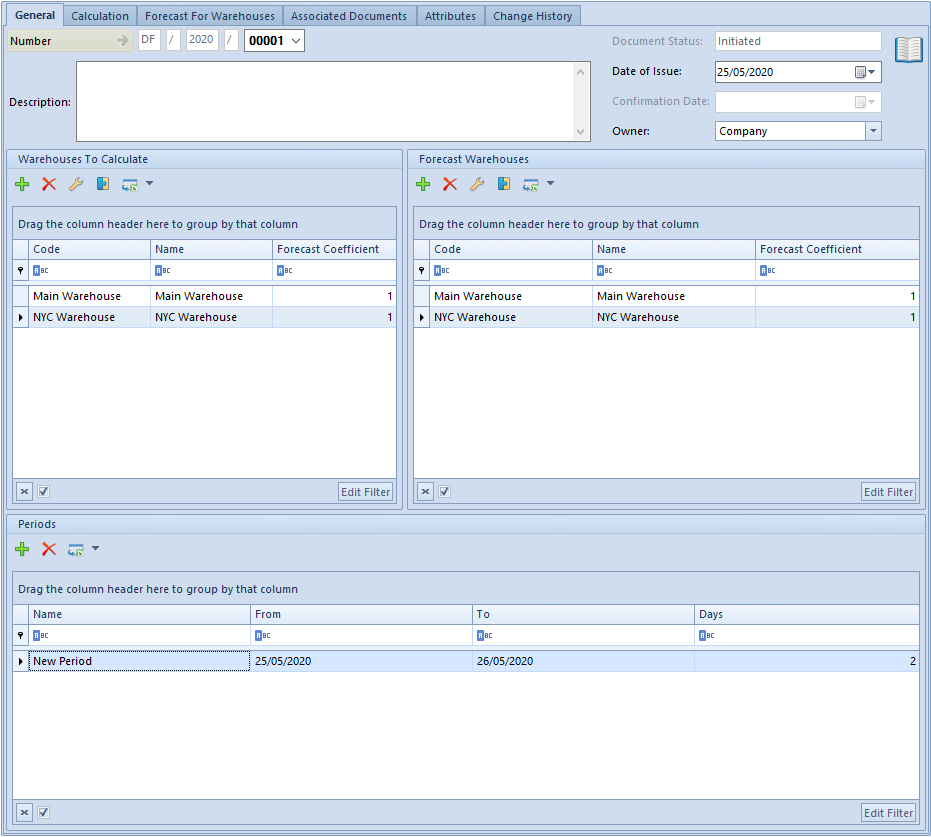
Demand forecast form – tab General
Tab General on demand forecast form
Warehouses to Calculate is a list of warehouses on the basis of which the historical stock levels are calculated. <<Forecast Coefficient>> defines size or weight (priority) of a warehouse and affects the distribution of the forecast quantities among warehouses.
Immediately above the list, button [Add To Forecast] is available, which allows for copying selected warehouse to the adjacent list.
Forecast Warehouses is a list of warehouses for which an item forecast is calculated. It is identical to the list of warehouses to calculate. Immediately above the list, button [Add To Calculation] is available, which allows for copying selected warehouse to the adjacent list.
Section Periods presents time intervals for which item sales forecast is calculated. The number of days is calculated automatically upon entering the dates. When changing the number of days, the end date of the period are modified accordingly in relation to the start date of the forecast period.
Note
It is not possible to define identical periods within one DF document.
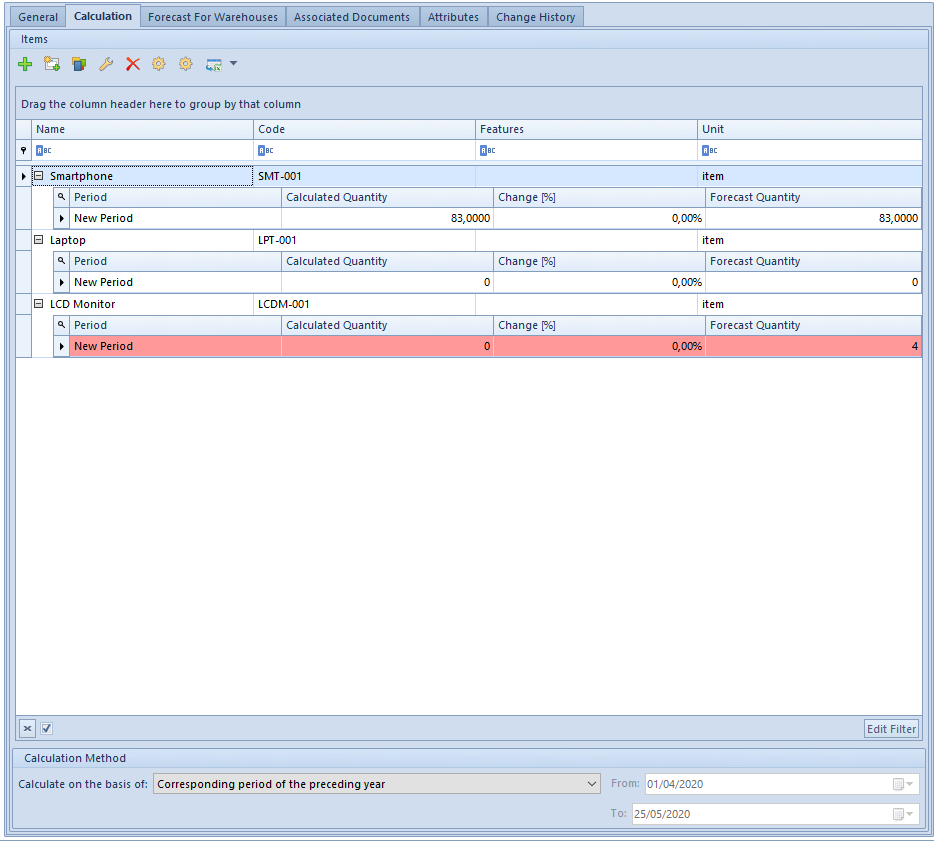
Tab Calculation
Calculation is a stage during which items for which a forecast is calculated and the method of its calculation are defined.
It is possible to select items upon clicking on button:
[Add] – opens a window with list of items, an item is added onto the document without lot
[Add By Features] – opens a window with list of items, all lots defined for a given item are added onto the document
[Add By Features Through Form] – opens a window allowing for selecting items along with their lots
For the selected items it is necessary to define a historical period on the basis of which the forecast is calculated. The following options are available for selection:
Corresponding period of the preceding year – default option, the calculation of the historical sales (calculated quantity) is performed on the basis of corresponding periods of the preceding year for each defined period
Example
The following periods have been defined in a forecast: January 2018, February 2018, March 2018. For parameter Calculate on the basis of, the option of corresponding period of the preceding year has been selected. When calculating the historical sales, therefore, the following quantities will be calculated:
for January 2018 – sales from January 2017
for February 2018 – sales from February 2017
for March 2018 – sales from March 2017
Preceding period – the calculation of the historical sales (calculated quantity) is performed on the basis of a period preceding the forecast period.
Example
The following periods have been defined in a forecast: January 2018, February 2018, March 2018 For parameter Calculate on the basis of, the option of preceding period has been selected. The periods on the basis of which the historical sales will be calculated will the preceding three months before the start of the first forecast period: December 2017, November 2017, October 2017. The basis for calculating a forecast for:
January 2018 is the sales from October 2017
February 2018 is the sales from November 2017
February 2018 is the sales from November 2017
Specified period – the calculation of the historical sales (calculated quantity) is performed on the basis of an entered date starting the historical period – date From and the end date of this period – date To which constitutes the basis for calculation of historical quantity.
Sales for historical periods is calculated on the basis of confirmed SOR, IR-, SORQC and IR-QC documents whose “stocked” date is included in the indicated period.
It is also necessary to specify percentage value of sales change in forecasted periods.
Next to the name of each item there is a + sign. It expands a list of periods for which a forecast is being prepared along with information regarding the quantity calculated on the basis of the historical period.
If forecasted quantity is supposed to be different, its value can be changed manually in field Change [%] and <<Forecast Quantity>>. In such a case it is displayed in red to highlight the modified rows which will be changed after recalculation.
Percentual forecast quantity regards all warehouses indicated in the tab General.
In order to recalculate forecast quantity, e.g. after changing the method of calculation forecast quantity or the parameter Change (%), it is necessary to click on one of the following buttons:
[Recalculate] – recalculates the forecast quantity only for the items selected in the list
[Recalculate All] – recalculates the forecast quantity for all items defined in the list
Tab Calculation on demand forecast form
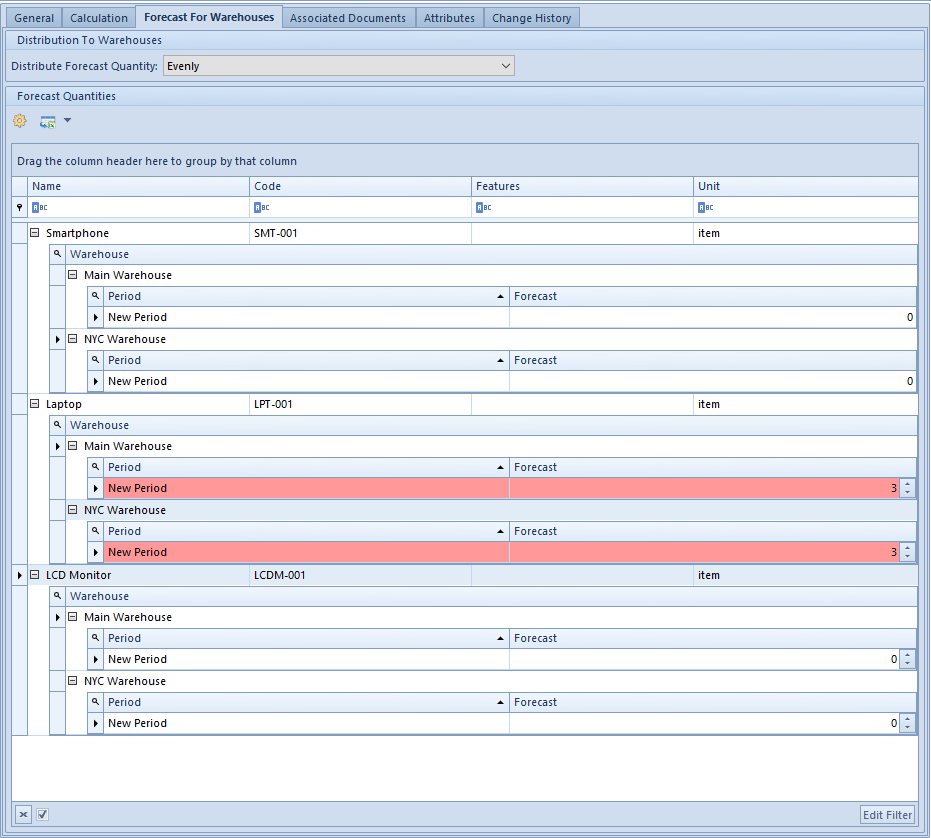
Tab Forecast For Warehouses
In this part of the demand forecast form the forecast quantity is distributed into forecast warehouses. After confirming forecast quantities indicated for each warehouse constitute the final result of the forecast included in item quantity calculation or when generating a purchase order.
It is necessary to define the method of distribution of the forecast quantity into selected warehouses. The following options are available for selection:
Evenly – after activating the distribution into warehouses the quantities of items will be distributed evenly into all warehouses within the forecast periods (regardless of the forecast coefficient defined for a warehouse)
Example
For period: January 2018, the forecast quantity of item BZKD is 800 pcs After distributing this quantity for this period into 2 warehouses, which were defined for the forecast (Warehouse CHIC and Warehouse NY), according to the Evenly method, 400 pcs were assigned to each of them.
Proportionally – after activating the distribution into warehouses the forecast quantity for each item in each period will be distributed in accordance with the forecast coefficient defined in the warehouse form
Example
For period January 2018, the forecast quantity of item BZKD is 800 pcs the warehouses have their coefficients defined:
Warehouse CHIC – 3
Warehouse NY – 5
After distributing this quantity for this period to Warehouse CHIC and Warehouse NY according to the Proportionally option, the following quantities were assigned: to Warehouse CHIC = 300 pcs (3/8 from 800), to Warehouse NY = 500 pcs (5/8 from 800).
In order for the quantities to be distributed, it is necessary to click on button [Distribute To Warehouses].
Section Forecast Quantities displays items for which a forecast is performed, including the calculated forecast quantity broken down into warehouses and periods.
Detailed information on individual items is available after clicking on sign “+” that is located next to each item.
In tab Calculation it is possible to change forecast value. A modified row is displayed in red to highlight the rows which have been modified manually and will be changed after recalculation.
Tab Forecast For Warehouses on demand forecast form
Upon completing tabs General, Calculation, and Forecast For Warehouses a document can be confirmed. The current date (confirmation date of a document) will automatically appear in a list of demand forecast documents in a given document in column Confirmation Date.
Generating a PO from demand forecast
It is possible to generate purchase orders only from a confirmed demand forecast.
When generating a document, an optimization window is opened which allows for specifying whether a PO should be generated for all periods and all warehouses or only for selected ones.
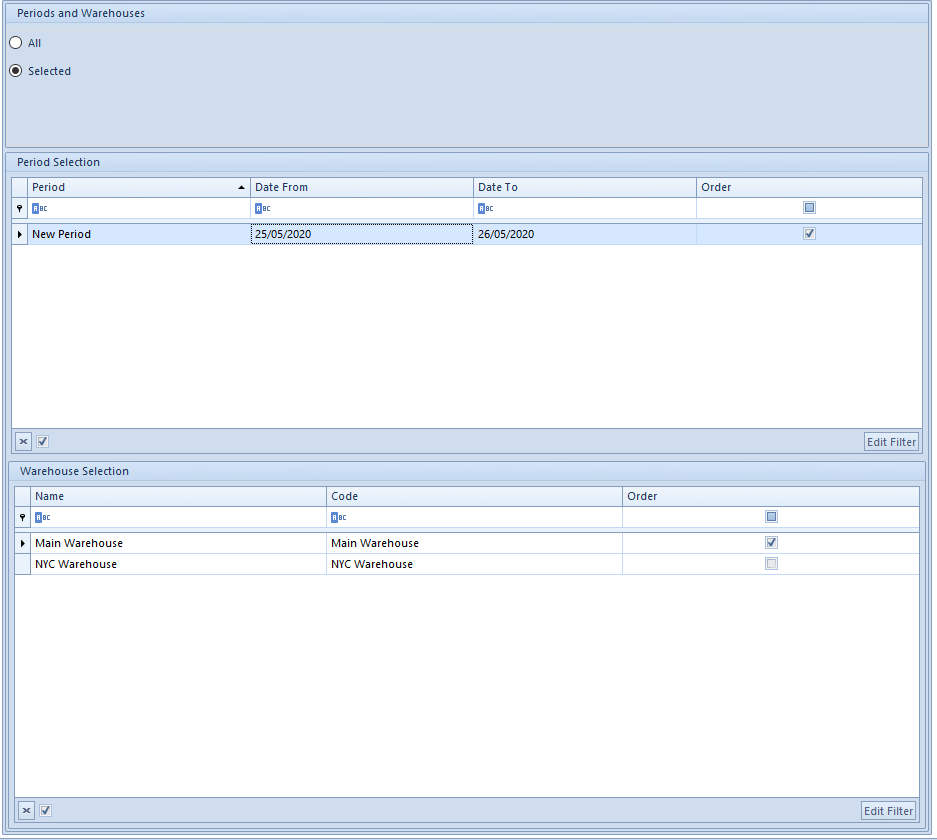
Optimization window of PO generation
Option All – is used when ordered merchandise will be released within a short period. For a long-term plan it is recommended to use option Selected. In that way, we avoid a situation of creating large stock levels in a warehouse, which can be slow movers for a longer period, but ensure a quantity required to meet the sales on an ongoing basis without the unnecessary overfilling for several periods ahead
After selecting option Selected in section Periods and Warehouses, sections Period Selection and Warehouse Selection are activated. They display information about forecast periods and warehouses defined in the source demand forecast document. Next to each item there is column Order, which allows for defining whether a given period and warehouse should be included in generation of a purchase order.
Subsequent purchase orders can be generated until the entire forecast quantity has been used up
In purchase orders generated from DF each item lot will be displayed as a separate document item.
Generating an IO from demand forecast
It is possible to generate internal orders only from a confirmed demand forecast.
When generating a document, an optimization window is opened which allows for specifying whether an IO should be generated for all periods and all warehouses or only for selected ones.
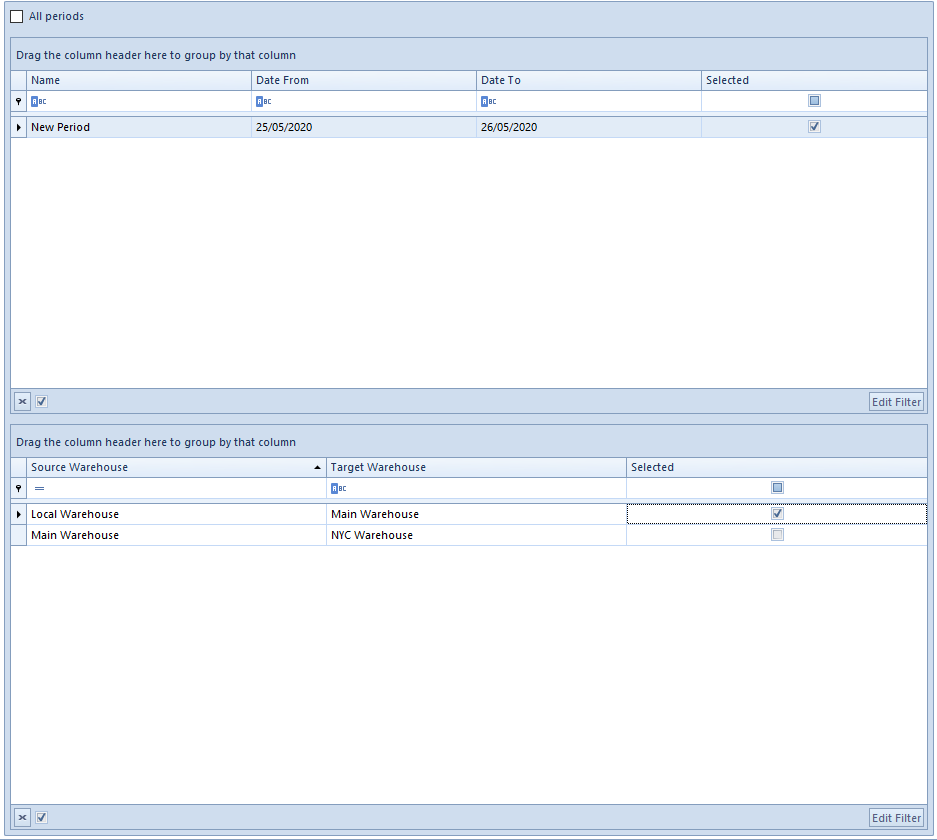
Optimization window of IO generation
Target warehouse is a warehouse defined in demand forecast as forecast warehouse. Source warehouse is a warehouse from which items are to be ordered. A default warehouse for the document is suggested by default. However, it can be edited.
Note
The button [Generate] is active only when at least one period and one pair of warehouses has been checked and the source warehouse is different from the target warehouse.
Subsequent internal orders can be generated until the entire forecast quantity has been used up
In internal orders generated from DF each item lot will be displayed as a separate document item.